Borrowing psychometrics for AI evaluation, and why the borrowed tool doesn’t always survive the trip
Every model leaderboard reduces a rich matrix of right and wrong answers into one number: accuracy. It’s simple, comparable, and it throws away almost all the information in the data.
Not every question is equally informative. A question every model gets right tells you nothing about who’s better. A question that only the strongest models get right tells you a lot. Treat all questions as equal, as a plain accuracy score does, and you dilute your signal, make rankings sensitive to which questions happened to be in the benchmark, and make it hard to compare results across benchmarks at all.
This is an old problem, and there’s an old solution: Item Response Theory (IRT), the statistical backbone of standardized human testing for the last 60 years. It’s showing up increasingly often in AI evaluation for latent capability scoring, for flagging low quality benchmark items, and for compressing huge benchmarks into small, informative subsets. The idea is elegant. The execution deserves more scrutiny than it’s getting.
A 5 minute primer on IRT
IRT models the probability that an “examinee” answers an “item” correctly as a function of a latent ability θ and item specific parameters. The three standard flavors:
1PL (Rasch model) every item is characterized only by difficulty b:
`p(correct | θ, b) = σ(θ − b)`
2PL adds a discrimination parameter a, so items differ in how sharply they separate high and low ability examinees:
p(correct | θ, a, b) = σ(a · (θ − b))
3PL adds a guessing parameter c, the floor probability a very low ability examinee still gets it right:
p(correct | θ, a, b, c) = c + (1 − c) · σ(a · (θ − b))
Given a response matrix (rows = examinees, columns = items), you jointly estimate every examinee’s θ and every item’s parameters. Standard estimation approaches include marginal maximum likelihood (MML), MCMC, variational inference (VI), and more recently neural embedding based estimators that learn ability and item representations end to end.
Applied to AI evaluation, “examinee” becomes “model” and “item” becomes “benchmark question.” Instead of ranking models by raw accuracy, you rank them by estimated θ. Instead of treating every question equally, you use estimated difficulty and discrimination to identify which questions actually carry signal, and which are noise.
The regime mismatch nobody checked
Here’s the catch: every one of those estimation methods was designed, tuned, and validated for human testing, and human testing has a very specific shape.
| Aspect | Human Testing | AI Benchmarking |
|---|---|---|
| Number of Examinees | 250–1,000s | 10s–100s |
| Number of Test Items | 50–200 | 100s–10,000s+ |
| Score Distribution | Usually approximately normal | Often skewed, clustered, or multimodal |
That’s not a small deviation it’s close to an inversion. Classical psychometric guidance calls for at least 250–500 “examinees” for 1PL/2PL, and 1,000–3,000 for 3PL, with item counts far smaller than that. AI benchmarks routinely flip this: dozens of models, thousands of items. And model capability doesn’t look like a bell curve it looks like a long tail of similar open weight checkpoints with a few frontier outliers sitting well off to one side, or distinct clusters separated by architecture generation or scale.
Both of the core assumptions IRT estimation leans on enough examinees relative to parameters, and a roughly normal ability distribution get violated simultaneously. So the natural question is: does the machinery still work?
What actually breaks
Running IRT estimation across this mismatched regime small to moderate model counts, large item pools, real (non normal) capability distributions, and the four common estimation approaches (MML, MCMC, VI, and a neural embedding estimator) surfaces a few consistent failure patterns:
1. Classical estimators can become computationally infeasible. MML, the textbook approach, chokes on item pools in the thousands running out of memory or failing to converge, especially under the more flexible 3PL model. MCMC scales reliably but slowly; for large item pools and large model counts, individual estimation runs can take hours. Neural embedding estimators stay fast and don’t fail outright, but they don’t come with the uncertainty quantification or consistency guarantees classical methods offer.
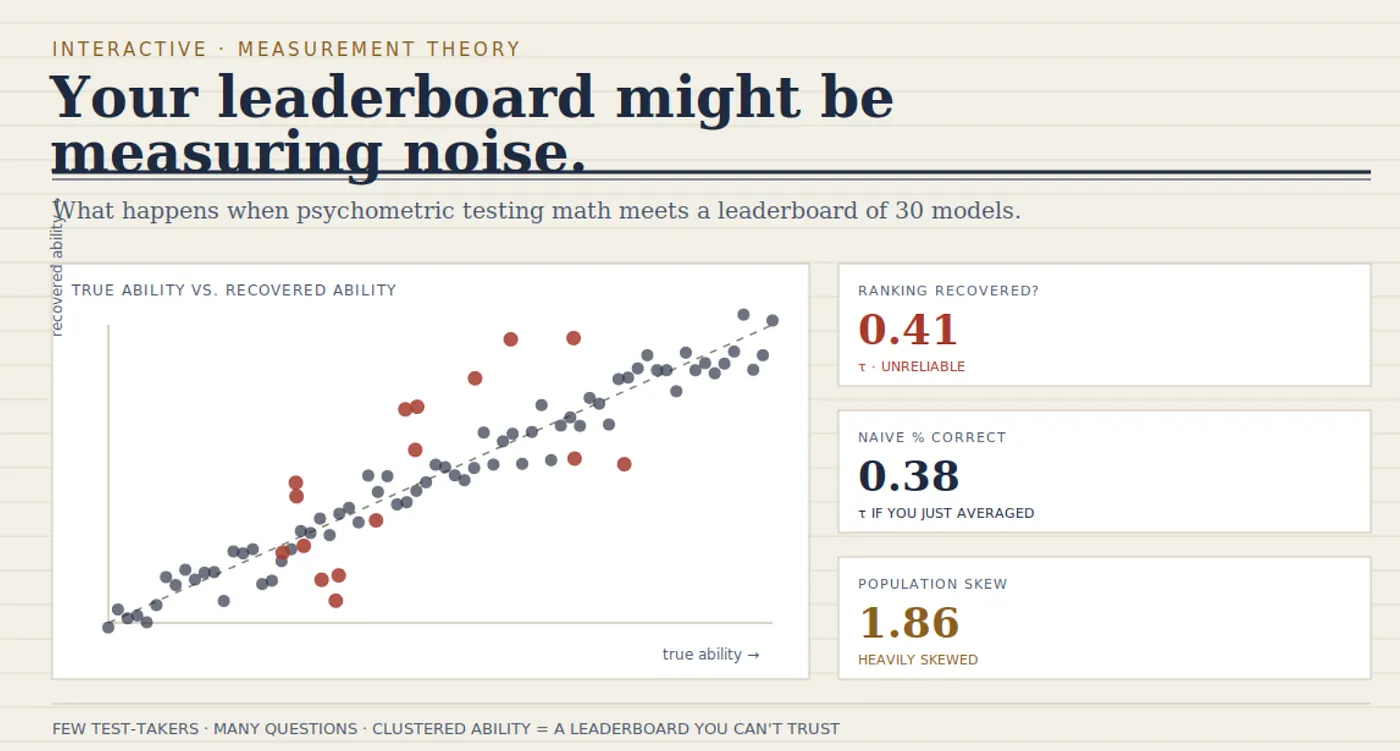
2. Ranking recovery lives and dies by distribution shape, not by which estimator you pick. This is the finding that should worry practitioners most. Across every estimation method tested, the single biggest predictor of whether estimated model rankings matched true rankings wasn’t the estimator, the item count, or even the sample size it was the skewness of the underlying capability distribution. Rankings recovered well (correlation > 0.85) when the distribution was close to symmetric, and degraded sharply (below 0.6) as skewness increased. Differences between the “best” and “worst” estimator, in comparison, were minor. A cleverer estimator does not rescue you from a badly shaped population.
3. Item level diagnostics need real sample size, and small model pools don’t have it. With too few models, difficulty and discrimination estimates for individual items become unreliable across the board which matters a lot if you’re using those estimates to decide which benchmark items are “good” or to build a compressed, adaptive test from them. Reliability improves markedly once you cross roughly 100 evaluated models, with diminishing (but still positive) returns after that.
4. Benchmark compression is comparatively robust with caveats. Using estimated item informativeness to build a short form benchmark and predict full benchmark rankings on held out models does consistently beat random item selection. But the margin is modest, and unlike full ranking recovery it doesn’t degrade predictably with distribution skew, which means the mechanism driving when compression works well isn’t yet well understood.
Why this matters beyond the math
None of this means “don’t use latent ability models for evaluation.” It means the inference you’re allowed to draw depends on conditions you have to check, not assume:
- How many models did you actually evaluate? If it’s under ~100, treat item level quality claims (this question is “good,” this one is “saturated”) with real skepticism.
- What does the capability distribution look like? Plot it before you trust the ranking. If it’s clustered or heavily skewed which is common, since “capability” in practice means a long tail of similar open models plus a few frontier outliers expect ranking recovery to be unreliable regardless of which estimator produced it.
- Which estimator, and does it even finish? The fastest estimator is not automatically the most trustworthy one; conversely, the theoretically “gold standard” approach can simply fail to run at your benchmark’s scale.
- Can you validate before you trust it? The most robust practical move is a recovery check: simulate data from your own estimated parameters, re estimate, and see whether you get your original rankings back. If you can’t recover your own simulated ground truth, you have no basis for trusting the ranking from real data either.
Measurement theory built for a classroom doesn’t automatically transfer to a leaderboard just because both involve a response matrix. The shape of your data determines whether the tool is measuring signal or manufacturing a confident looking number out of noise.
— — — — — — — — — — — — — That’s a Wrap — — — — — — — — — — — — —
That’s all for today. Thank you for reading today’s edition. See you in the next issue with more Inference Weekly insights.
PS: We curate this Inference Weekly content for free, and your support means everything. If you find value in what you read, consider sharing it with a friend or two.
Your feedback is valuable: If there’s a topic you’re stuck on or curious about, reply to this email. We’re building this for you, and your feedback helps shape what we send.